A while back I was looking for a vROps management pack that would ping IP addresses to check availability and response time for a given list of endpoints. A search of the VMware Solution Exchange returned nothing however recently I discovered the Port Adapter management pack.
Initially from reading the documentation, I thought that the pack was only able to monitor ESXi host ports:
The port adapter is an embedded adapter for vCenter Operations Manager. The adapter monitors the availability state and response time of ports on hosts.
Upon further reading I found my assumption to be incorrect and installed the pack in my lab to see what functionality it had.
In summary the management pack reads a text file which you define a list of IP addresses or hostnames and ports:
- 192.168.40.1 80
- 192.168.40.2 3389
- 192.168.40.3 22
You can also define multiple ports per endpoint like this:
- 192.168.40.4 443 53
Installation
I tested the installation on vROPs 6.1, 6.2 & 6.4 but it should work for all versions including the older vCOps
- You can download the management pack here, there doesn’t appear to be a license restriction and the download is free of charge. You need an account to download the pack but this is also free.
- Once you have logged in, download the pack by selecting the try button on the right of the page
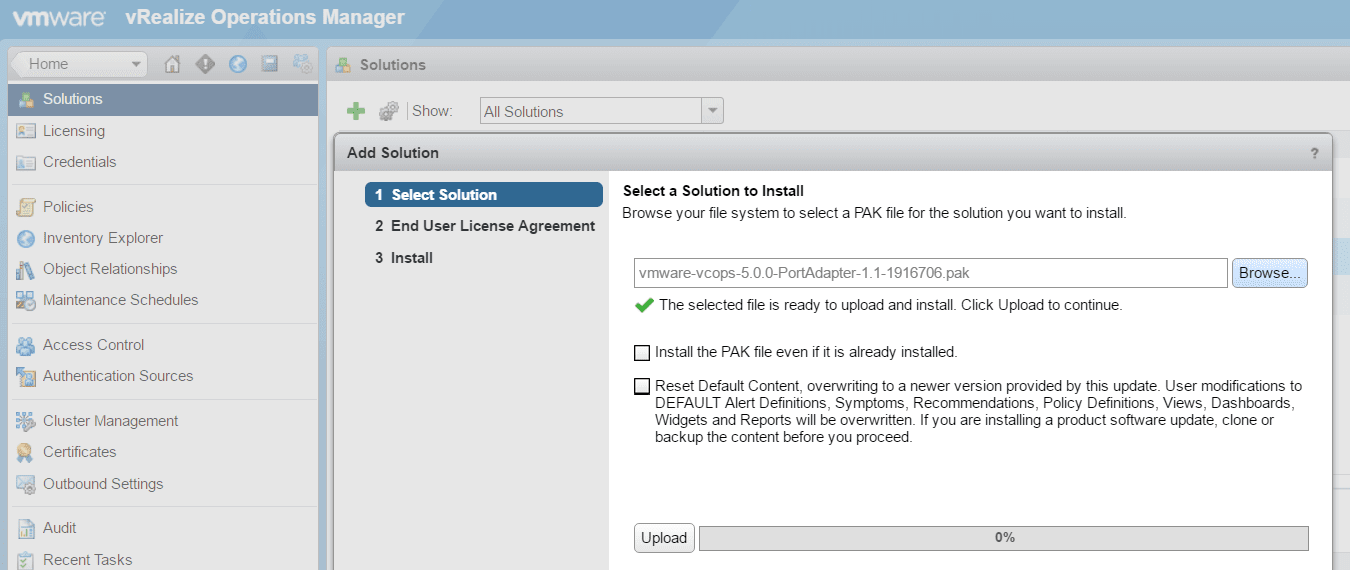
- Login to your vROps instance and navigate to Home > Solutions (Press the plus icon to add a new solution)
- Browse for the .pak file downloaded earlier, upload and accept the defaults

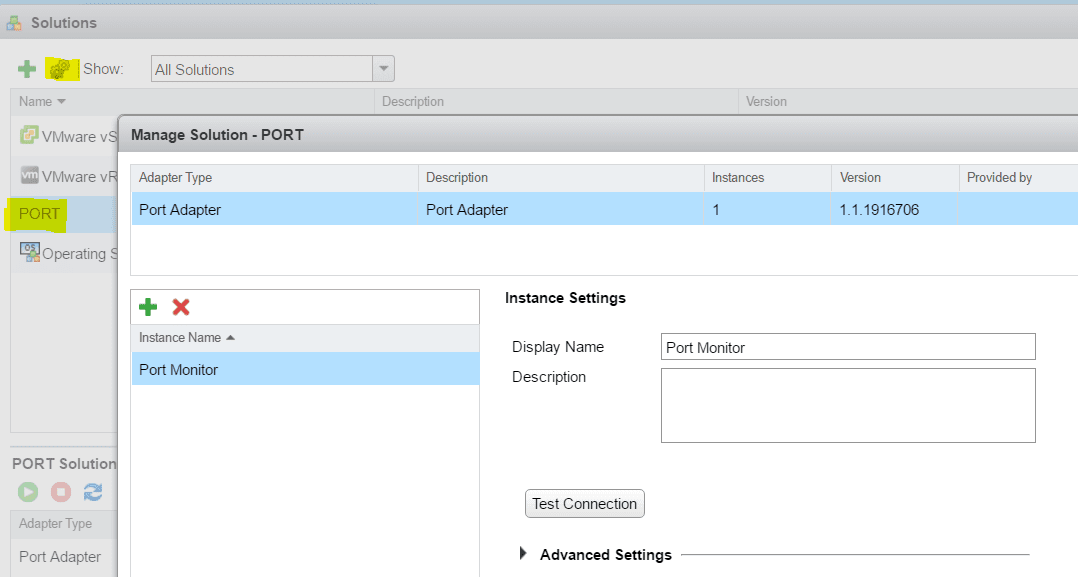
- Close the wizard and select the PORT solution then click the configure icon

- Give your instance a name. I simply called mine Port Monitor
- Save and exit the wizard
- Next you need to login to the console or SSH to the vROps appliance and edit the default text file with all the IP addresses and ports you want to monitor
- I simply login to the console with the admin account
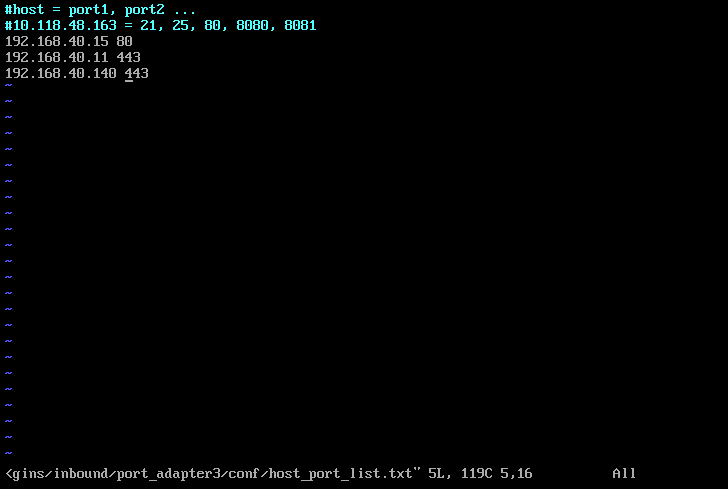
- Use VI to edit the text file located here: /usr/lib/vmware-vcops/user/plugins/inbound/port_adapter3/conf/host_port_list.txt

- Here is my example before I save it. Note that it can take up to 15 minutes for this to take effect

- Now go back to the vROps UI and create a view (Home > Content > Dashboards > New) You need vROps Advanced or Enterprise to create new dashboards but it’s still possible to create alerts if you have the standard version. See further down for details
- For ease I created a basic dashboard and a video to show you how I built it
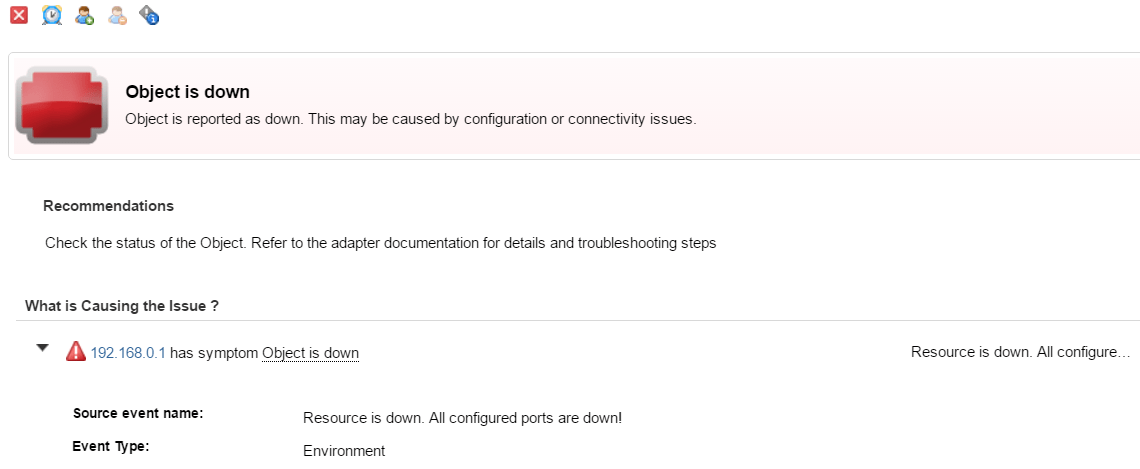
Out of the box there is an alert for object is down, you can create custom email alert notifications from this alert. If you want to create your own alerts then this can be done by creating your own symptoms and definitions. Example below:
- Home > Content > Symptom Definitions > Metric / Property Symptom Definitions
- Copy these settings, changing the port where required. You need to create a symptom definition for every port you are monitoring so change the port number accordingly each time

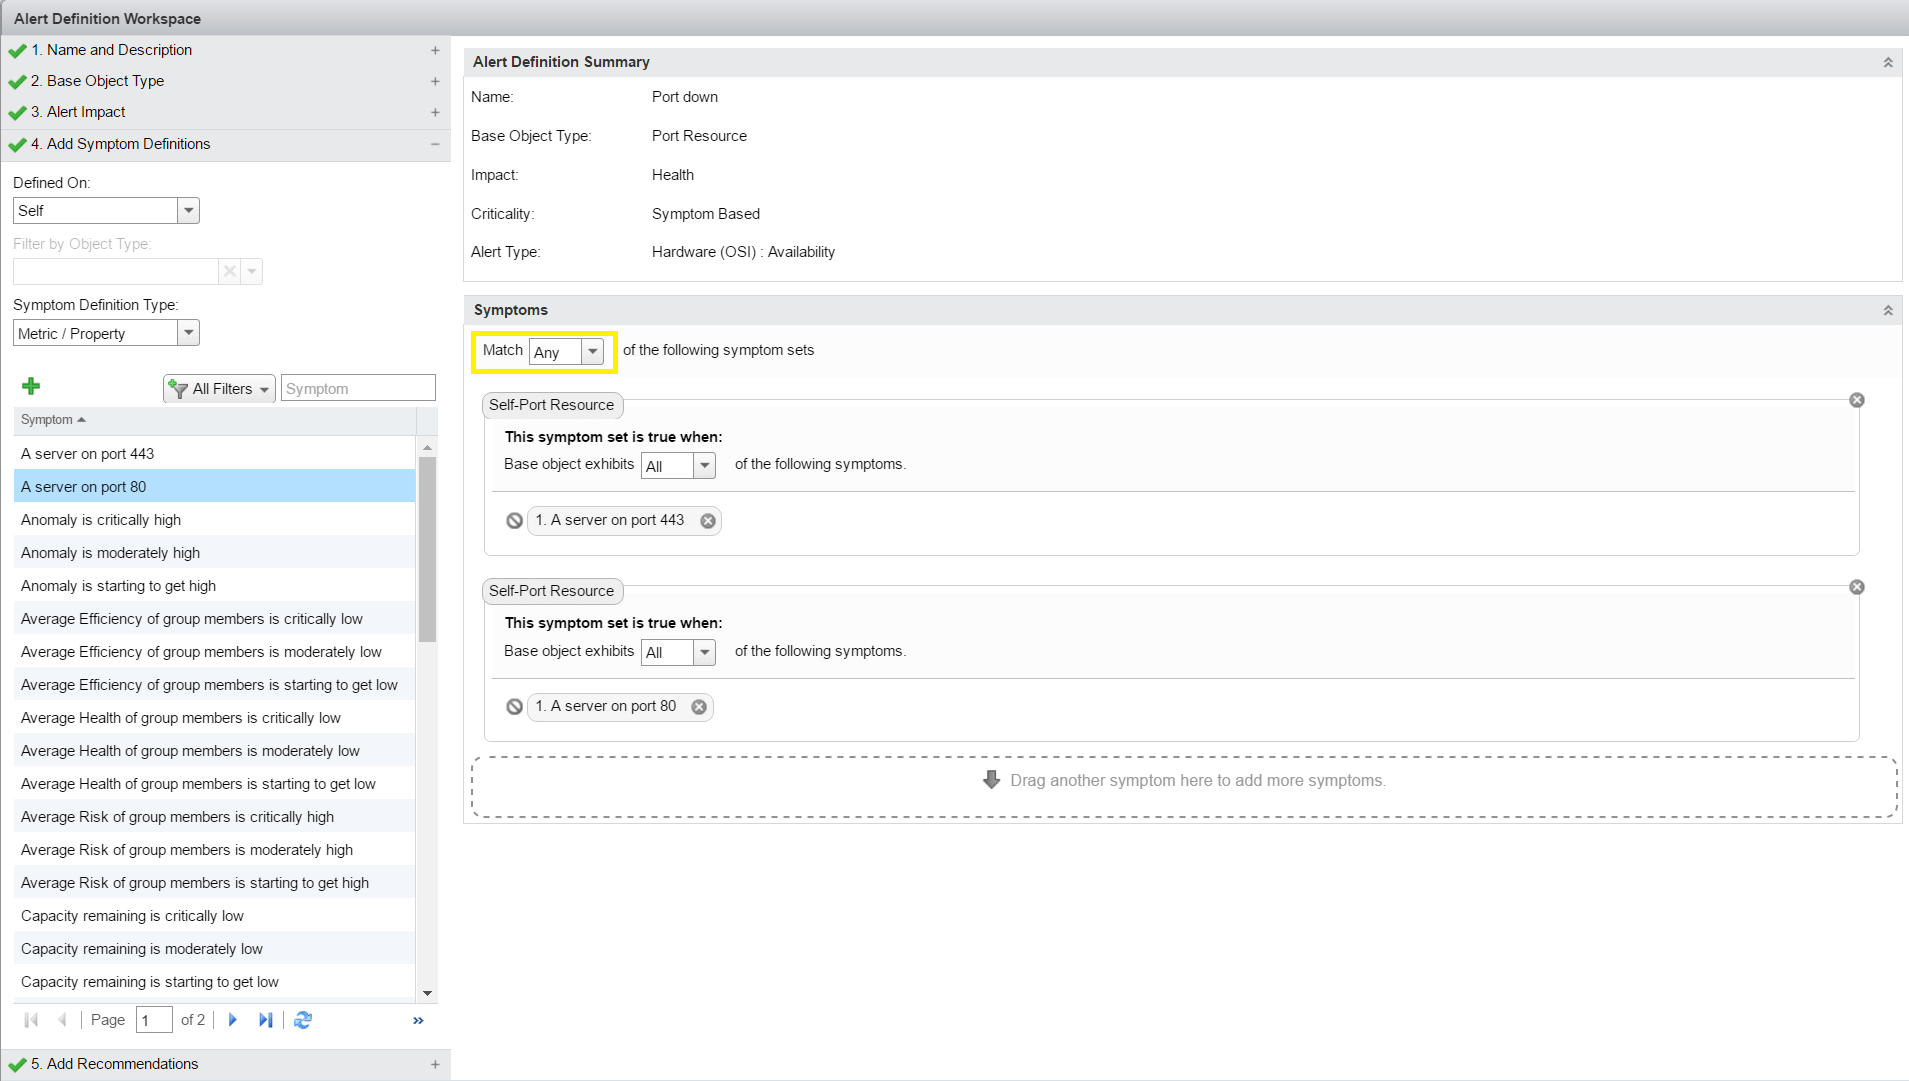
- Next create an alert definition. You only need one alert definition because one can include all the symptoms created earlier

- Remember to add another symptom and include it in your alert definition whenever you decide to monitor additional ports
That’s it! If one of the ports go down that you are monitoring, you will get a critical alert in vROps. You can also create email alerts based on the alert definition
Below is an example of the built in alert which triggers when all ports for a given endpoint are not reachable
