Contents
This month the vExpert Cloud Management team challenged its members to utilise VMware Cloud Management tools to locate Zombie VMs. If we were able to do this, we were awarded a free T-Shirt and some trees planted in our name in the Amazon Rainforest. Quite a cool idea!
Of course, it’s more than just a fun game to get involved with, after all, there are many reasons why Zombie VMs cause problems for us.
Defining a Zombie VM & why are they a problem?
Zombie VMs are usually hidden and unintentionally unused VMs. Hidden could mean unregistered in the vSphere Client or running but in some strange folder somewhere. They could also be running on standalone hosts which are not listed in your vCenter Server Inventory.
They cause the following problems:
- They waste valuable Storage, CPU and Memory resources
- They cost the business more money in terms of licensing
- They have an unnecessary management overhead
- They contribute to unnecessary CO2 emissions
If we look into this in more detail, VMware discovered that in a recent 2019 VMware Data Center migration project:
- >40% of VMs were Zombie VMs and not marked for migration (almost 2000 VMs)
- Approximately $3 million of Data Center operational savings identified by removing the Zombie VMs
- Around 700KW of power saved, resulting in 410MT of annual CO2 reduction!
No wonder VMware is keen to help everyone reduce the number of Zombie VMs, it’s expensive and bad for the environment.
So how do we track Zombie VMs?
Well, there are free tools out there that will locate old VMDK files that are no longer attached to Virtual Machines. But what about VMs that are running but are no longer used? This seems like a more challenging problem to solve.
Fortunately, with tools like vRealize Operations Manager (vROps) we can! Free Hand on Lab here & Free trial here
So for vROps, how did I decide to tackle the problem of identifying the Zombie VMs?
First, I thought about what metrics I can use within vROps to identify Zombie VMs:
- Creation Date (An old VM might be a Zombie)
- Hardware Version (Older HW versions might indicate a legacy VM)
- Uptime (High uptime VMs that have not been patched either need patching or deleting)
- Power Status (VMs that are not powered on might be Zombie VMs)
- Network Usage (VMs usually need to communicate with other systems or end-users so a low Network Usage might be a good indicator)
- VMware Tools Version (As with Hardware Versions, an old VMware Tools version might indicate an old, unused VM)
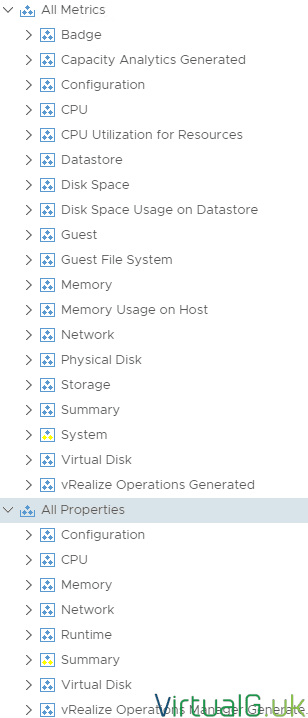
You see where I’m going with this, I simply took the list of Virtual Machine metrics and properties and marked ones which I thought could track Zombie VMs:
Identifying Zombie VMs
Once we have a way to track the Zombie VMs, we need to be able to identify them (This is the time-consuming part). You might think that track and identify are the same thing but for me, track is defining the metrics which we need to get a list of potential Zombies. From this, we need to accurately identify the Zombies.
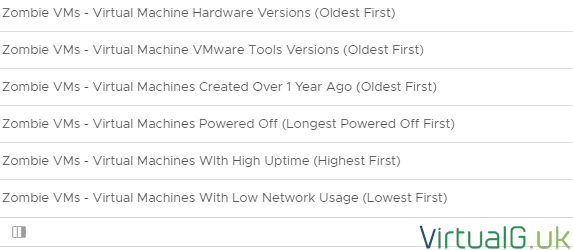
- For the identification stage, I decided to create a vROps dashboard to show all the VMs that relate to the above metrics. But first I had to create some Views based on the VM properties and metrics I found earlier:
- To easily identify the most promising VMs as Zombies, I used sorting and filtering in the views which were used to populate the dashboard. This means that while all VMs in the environment might be listed in a view, it’s the ones at the top of the list which will be most likely a Zombie.
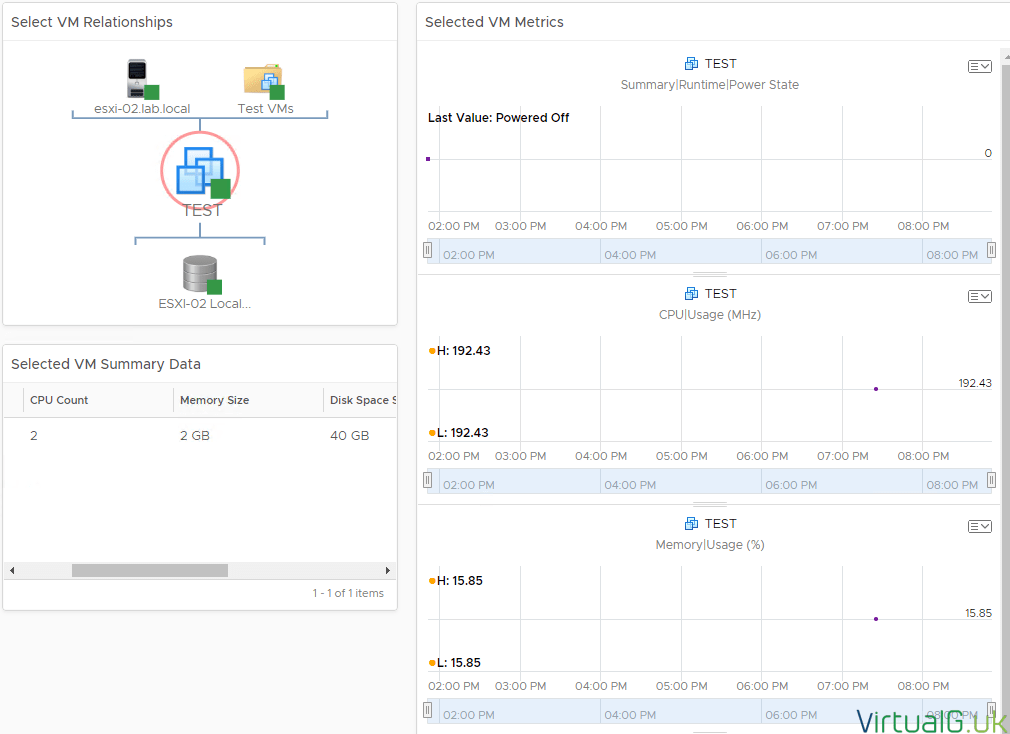
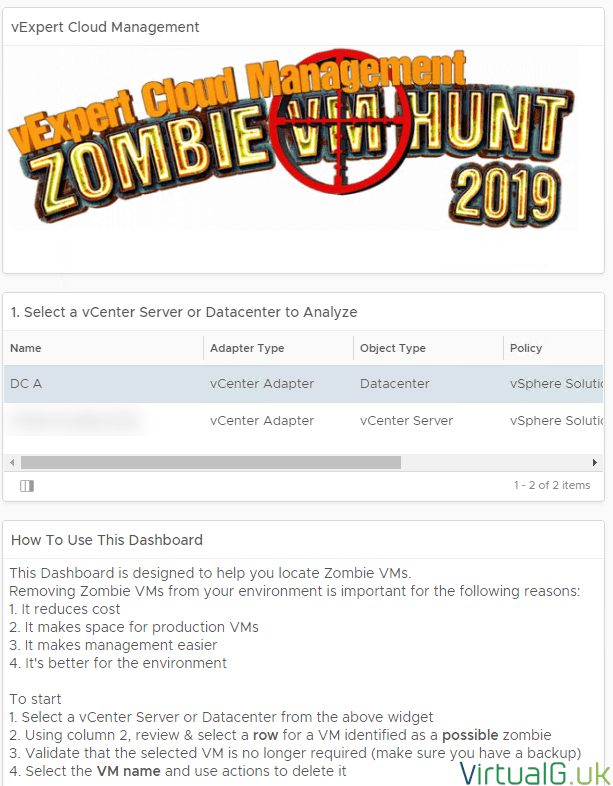
- Next, I placed all the views in a logical workflow onto the Dashboard. This means that you had to select a Data Center on the left and it would populate boxes on the right that were potential Zombie VMs. From here you can select one of the VMs and it will give you useful information about it.
- This includes location, specification and some other metrics to help prevent false-positive identification:
- I decided that for larger organisations, I needed to be able to show potential Zombie VMs based on vCenter Server or Data Center. To achieve this, I used an Object List Widget and limited it to only vCenter Servers and Data Centers.
- From here I set up an interaction link between the Object List Widget and every view
Finally, I applied an image view to give the dashboard some character and also some instructions for the Dashboard user to follow:
The final output looks something like this:
Next, we need to quantify the Zombie VMs
Before deleting the Zombie VMs from the environment, it’s important to take down some data.
At a minimum I suggest documenting the following:
- VM Name
- VM Folder & Tags
- Number of CPUs & Memory assigned
- Amount of disk space both allocated and consumed including any snapshots
Fortunately, you can create a quick view in vROps to show you all of this data before you delete the VM.
Why collect the data though?
Collecting the data is important for analysis. We can show management the hardware savings then work out a cost for those hardware components.
Going one step further and based on other data it would be possible to calculate CO2 savings which would be an interesting next project in vROps!
Next steps
Once you have gone through this process once, consider creating automated vROps reports for organizing the data and reporting back to management with ease.
You could also consider using other products in the vRealize Suite such as Log Insight to create alerts and other views.
Downloading the vROps dashboard
If anyone is interested in using my sample dashboard, please see the files which I have uploaded to the VMware Code Sample Exchange: https://code.vmware.com/samples/6663


