Contents
VMware’s vRealize Operations solution is a full cloud / on-prem management solution for your VMware infrastructure.
One of the best features in vROps is the ability to extend way beyond traditional VMware solution management.
In previous versions, a subscription to the True Visibility Suite was necessary to manage 3rd party solutions which VMware did not support, however in vROps 8.6, customers can now extend the monitoring and management of 3rd party solutions at no extra cost.
Extending vROps beyond native ability is achieved by downloading and installing .pak files. These .pak files add monitoring capability of other solutions, extra metrics and dashboards to encompass all of your other platforms into a single management solution.
To see all supported 3rd party applications, see the official support page here
Getting started is incredibly easy:
Prerequisites
Before we start, we need to ensure we are running a supported IIS version and that the required ports are open. We will also need to create credentials.
You can find the IIS management pack requirements here
- For IIS you’ll need an Access token, instructions for this are here The setup only takes a few minutes and adds an API to IIS for vROps to communicate with it via an access code.
All other supported management packs are here
Installing the Management Packs
- Launch the vROps UI
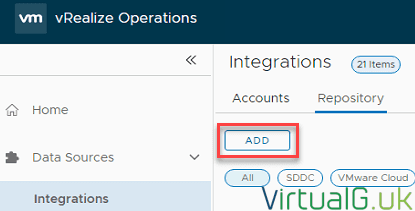
- Navigate to Data Sources > Integrations
- Select Add
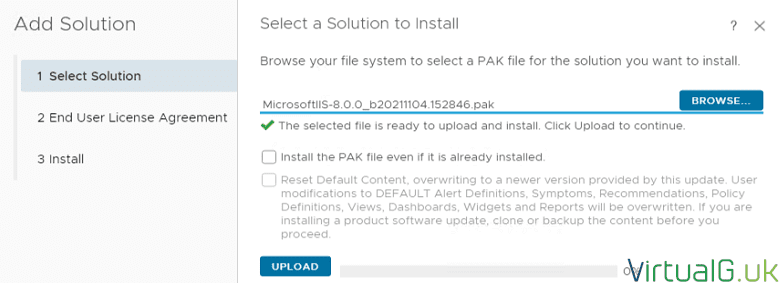
- Browse for your IIS management pack file
- Upload the management pack
- Select Next
- Accept the EULA
- Select Install to complete the installation
Reviewing all available Integrations
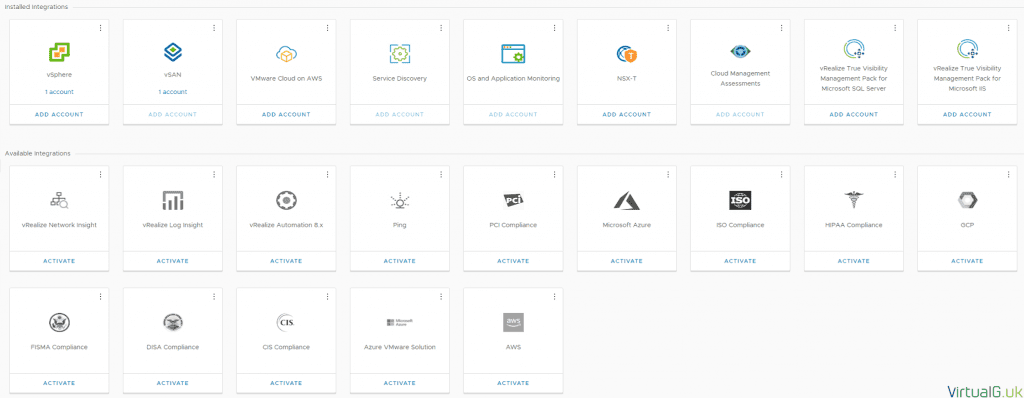
Once the .pak files are installed, you will see all the integrations which vROps now supports.
It’s worth a browse through as VMware are adding new native integrations all the time.
You can find this from the Data Sources > Integrations page:
Setting up the Integration
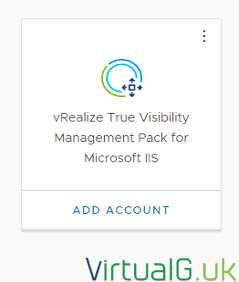
Every Integration will have different requirements. For the IIS integration, select Add Account from the Integrations page
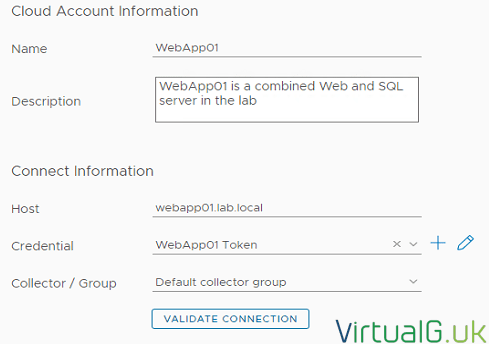
In the Add Account page, we need to connect vROps to the IIS server.
- Name: Give the instance a name
- Description: A meaningful description for the IIS instance
- Host: The FQDN of the IIS server
- Credential: Use the + icon to add a new credential. You’ll need to enter the access token created in the prerequisites
- Collector / Group. This will vary depending on your environment topology. For basic vRops deployments, simply add it to the default. You can change this later.
Validate connection to ensure the access token and host are correct. This will also ensure the port is open on the IIS server for API requests. You can change this under the Advanced Settings toggle.
Once the validation is successful, ensure you hit the Add button to continue.
Validation
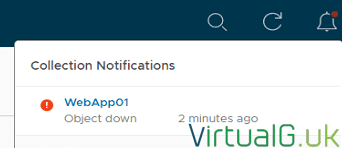
Check the notification icon on the top right of the vROps UI for any issues.
In my environment, there was an Object down alert for the collector. Select the name of the integration.
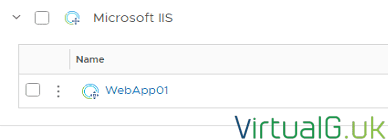
Expand Microsoft IIS to ensure the Name is displayed
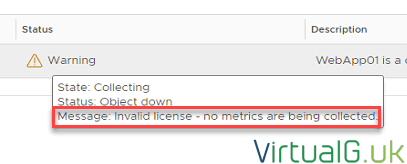
Hover over the Warning to see the issue:
Here you can clearly see that the issue is due to a license problem.
To resolve this issue, navigate to:
- Administration > Licensing
- Select Add
- Select the correct vRealize True Visibility Management Pack
- Enter your TVS license key followed by Save
To trigger the start of the collector, navigate to the previous page with the warning
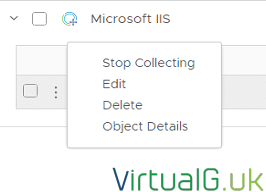
- Select the 3 dots
- Choose Stop Collecting
- Wait for the collector to stop
- Then hit the 3 dots again and start collecting
After a few minutes, the alert should dismiss automatically.
Reviewing the new functionality
Wait 15 minutes for a full collection to complete before inspecting the new functionality.
Dashboards
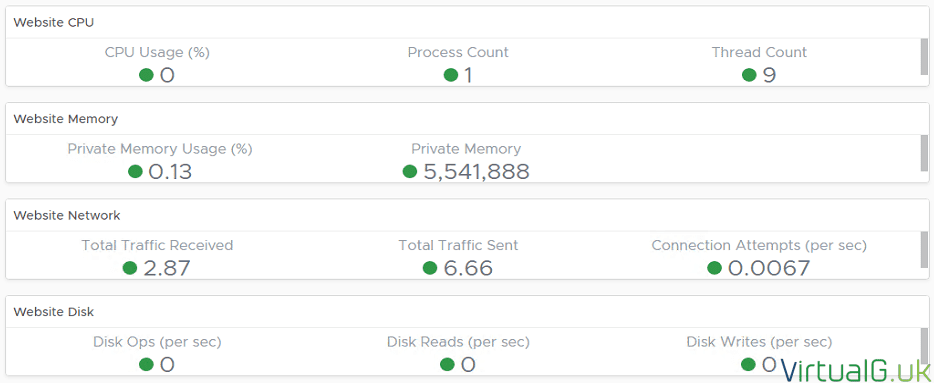
- You can now navigate the Dashboards from the Visualise > Dashboards > All > Microsoft IIS panel
Here you can see everything from the Overview, Webservers and even data on the specific websites which your IIS server is hosting.
Metrics
- Open Environment > Object Browser and find your new IIS objects
- You’ll find them under the Microsoft IIS folder
Once you have opened an object, you can select it’s metrics and properties. This is useful for troubleshooting.
You can then use these metrics and properties to build your own dashboards, alerts and scheduled reports
Reports
- Open Visualize > Reports
- Use the search for IIS
- Select the Microsoft IIS KPIs Report and use the dots to run the report. Note hos you can edit them and schedule them to run automatically.
- After the report has been generated, select the number under the “Generate reports” column to open the reports list.
- Next to the report of interest, hit the PDF or CSV to open the report.
Alerts
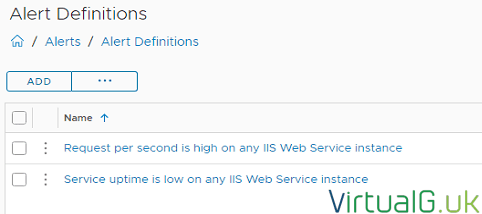
- Navigate to Configure > Alerts
- Select Alert Definitions and use the search for IIS
You can see a few default alerts are already setup. You can create additional alert symptoms and definitions and add them to your alert notifications as required.
That’s it. You can also use all of the other built-in vROps functionality with the new IIS management pack.
Be sure to check the other management packs here







[…] Monitoring IIS Websites with vRealize Operations by Graham Barker (@virtualg_uk) Great Britain […]