Contents
For anyone who has followed the blog for some time, you’ll know I’m a fan of good monitoring solutions. Proactive monitoring is essential to a happy end user, which reflects well on the IT team.
ChromeOS Monitoring
With the uptake of cheaper, more portable devices running ChromeOS as an example, more recently I’ve noticed a gap in the industry in the monitoring and management of such platforms. This week I have been looking at Goliath Technologies ChromeOS/ChromeOS Flex Monitoring solution and so far, I’m impressed!
Goliath Technologies

Goliath Technologies is an award-winning provider of end user experience monitoring and troubleshooting solutions. They support a number of VDI platforms including Citrix, Microsoft and VMware.
Furthermore, Goliath Technologies boasts about being the only solution available to help monitor ChromeOS (Chromebook) and other related devices. They offer comprehensive monitoring of small and large deployments of ChromeOS devices, with the ability to support Citrix and VMware EUC applications at the same time. Such deep integration offers reduced remediation times for end-user-related issues.
Inventory of User Sessions
Discover and view ChromeOS devices automatically and quickly identify them within your overall inventory using the quick filter option.
The ChromeOS monitoring capabilities automatically scan the estate and add them to your portal, this limits the manual effort that some other monitoring systems typically require. It’s also a great way to find devices that you may have forgotten about or that you thought were lost. Primarily though, it ensures that all existing and new ChromeOS devices are automatically pulled into the overall device inventory within Goliath so IT can begin monitoring and troubleshooting end user experience automatically with new device rollouts.
As you would expect, the software is capable of showing details about the physical Chromebook hardware usage and other useful metrics about the device.
Goliath takes that telemetry so much further though and correlates the device, all the underlying IT delivery infrastructure, user connection, and even user behavior and serves it up in an easy-to-use dashboard. The inventory of ChromeOS devices and user sessions is just the start though.
ChromeOS Device Health & Performance
View ChromeOS device telemetry on performance and usage to quickly diagnose issues impacting overall device performance.
In the screenshot below, we can see some of the metrics available to us. Notably, the user, device, and metrics are all linked together so you can quickly attend to the user before they start to see major impact on their ability to work.
There are also pre-built thresholds making it easy to visually see where issues are taking the guesswork out of troubleshooting so even novice IT generalist can troubleshoot like a seasoned IT specialist.
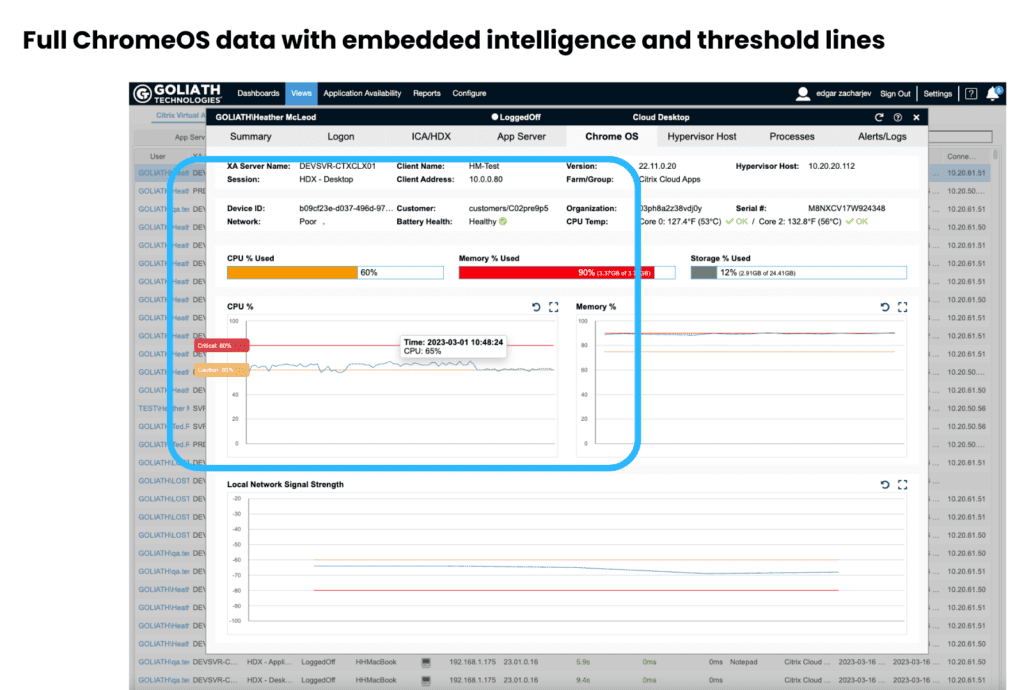
It’s also nice to see some attention paid to the network here too. and having visibility into this, particularly with remote users, addresses a major blind spot for IT. This is often overlooked when troubleshooting a poor end-user experience. and having visibility into this, particularly with remote users, addresses a major blind spot for IT.
ChromeOS correlated with Citrix session performance
The real power of the ChromeOS monitoring software is its powerful integration into Citrix. You may have noticed the tabs on the previous screenshot, tabs to different infrastructure elements, each of which could be causing a negative end-user experience.
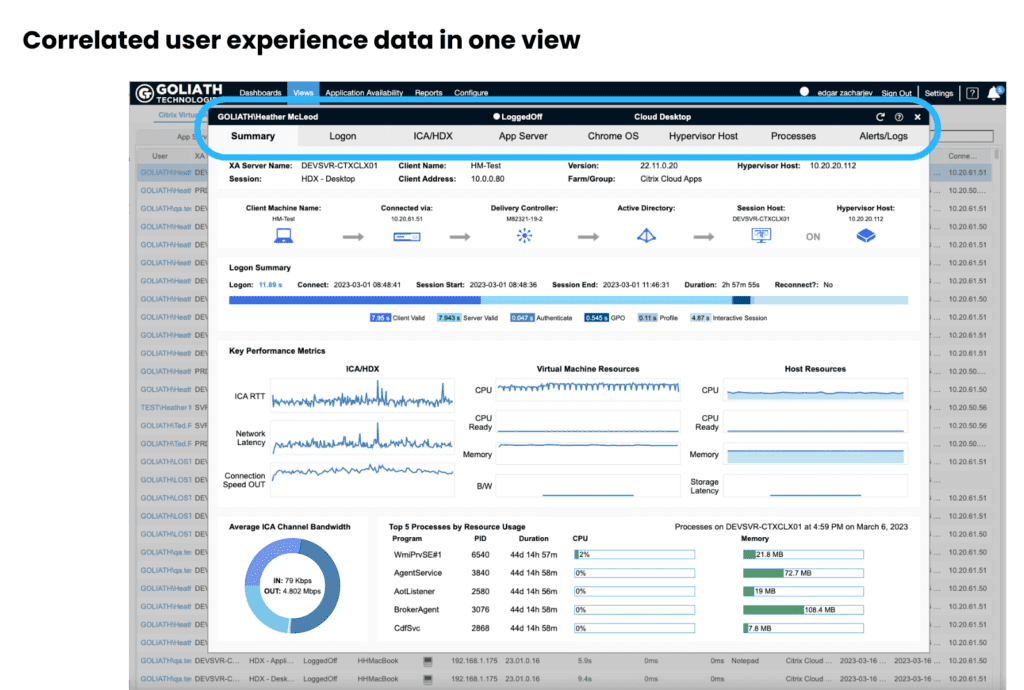
In the above screenshot, we can see how effortless it is to switch between the user’s ChromeOS device and other tabs to identify where their issue may be located in the stack.
With Citrix having many layers of components to serve a user session, this summary tab is a nice way to identify which combination of components the user’s session is using for further analysis.
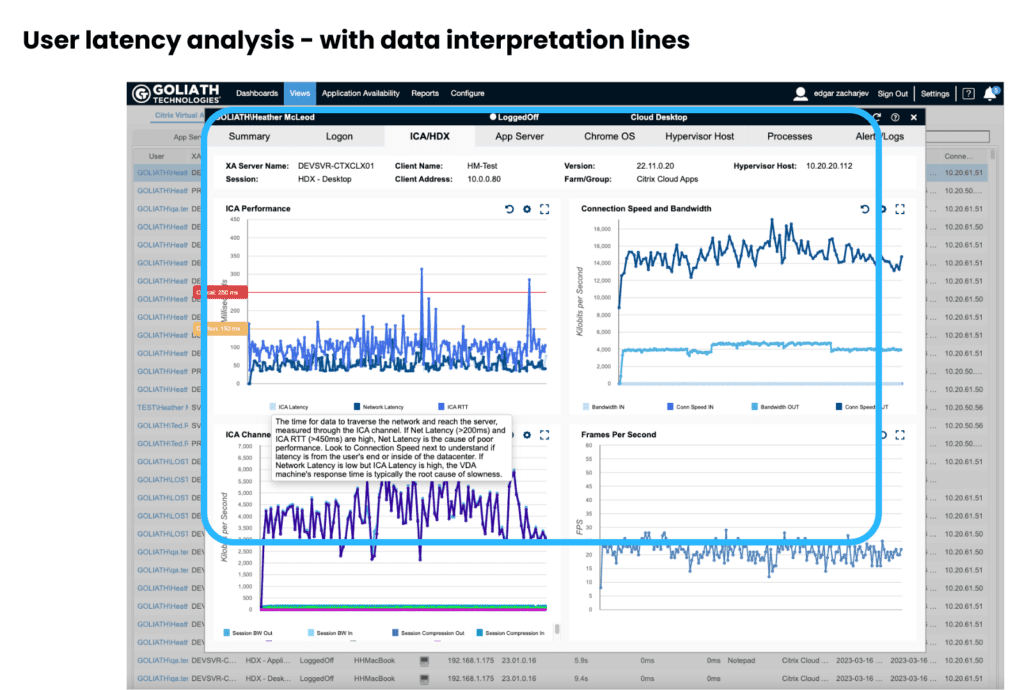
Going one further though, the Citrix integration is impressive because it also allows you to analyze each of the Citrix components at a deeper level. For example, it’s possible to look at the ICA/HDX latency performance on another tab:
It’s also possible to inspect how well a user’s ChromeOS device is performing while a Citrix session is open:
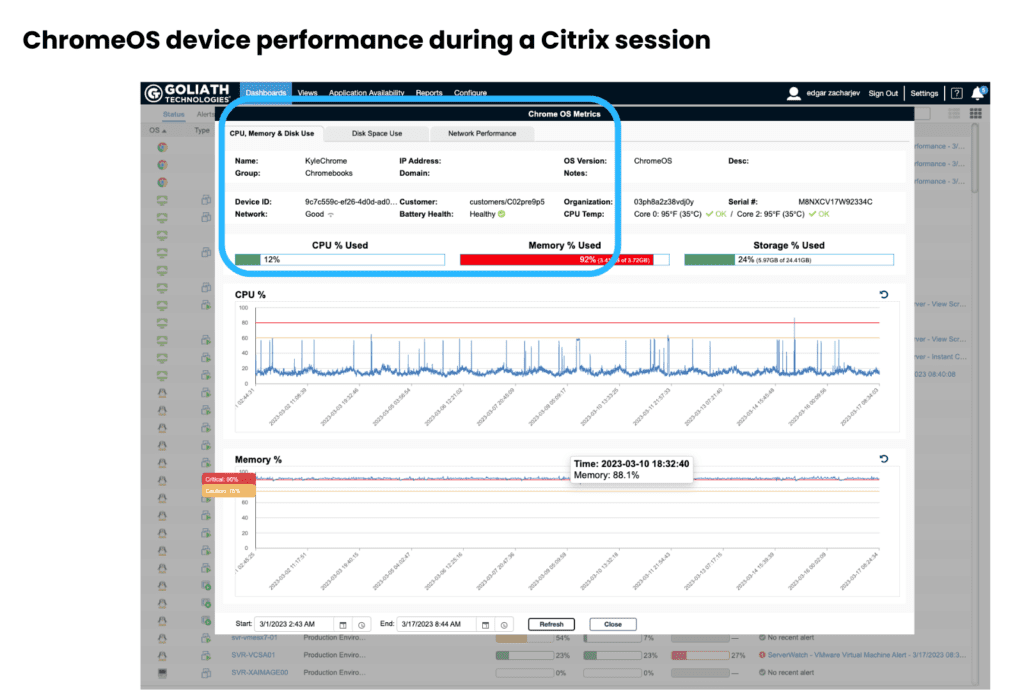
Here I like the pre-built visible thresholds on the charts, making it easy for support teams to identify metrics that are approaching the boundary of acceptable performance.
There is automated alerting tied to the thresholds as well. In addition, the thresholds can be customized. Let’s say you have an office located in a region that has notoriously poor connections. You may adjust the thresholds to accommodate that.
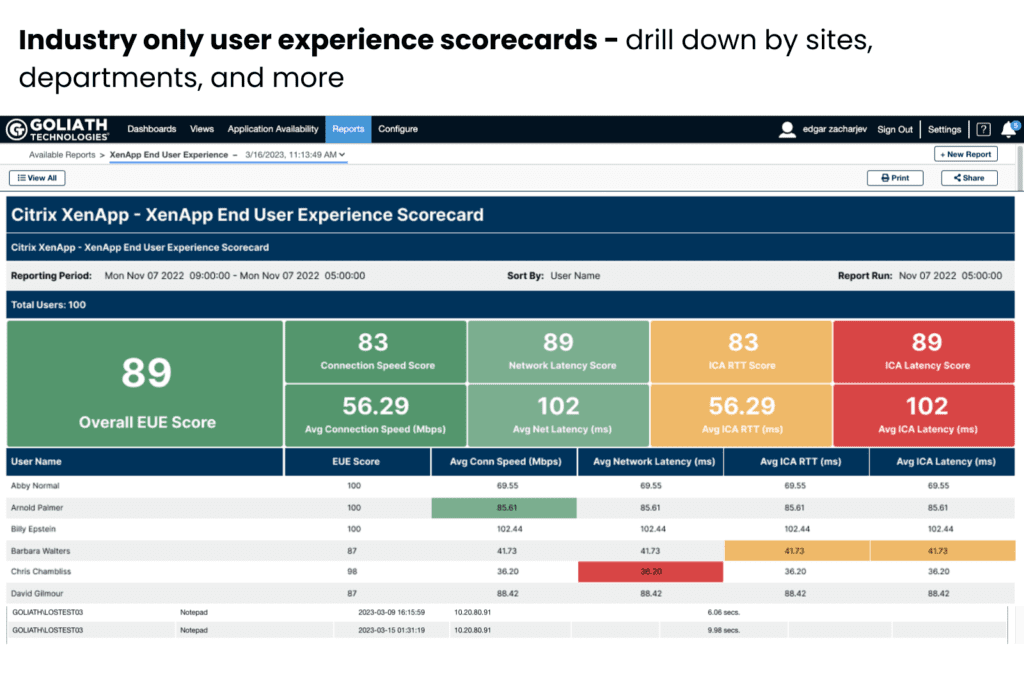
No monitoring solution would be complete without reporting abilities and Goliath Technologies is no exception here. A number of reports are available to run. These focus on user experience and you can choose a point in time to see how the performance of systems has improved over time.
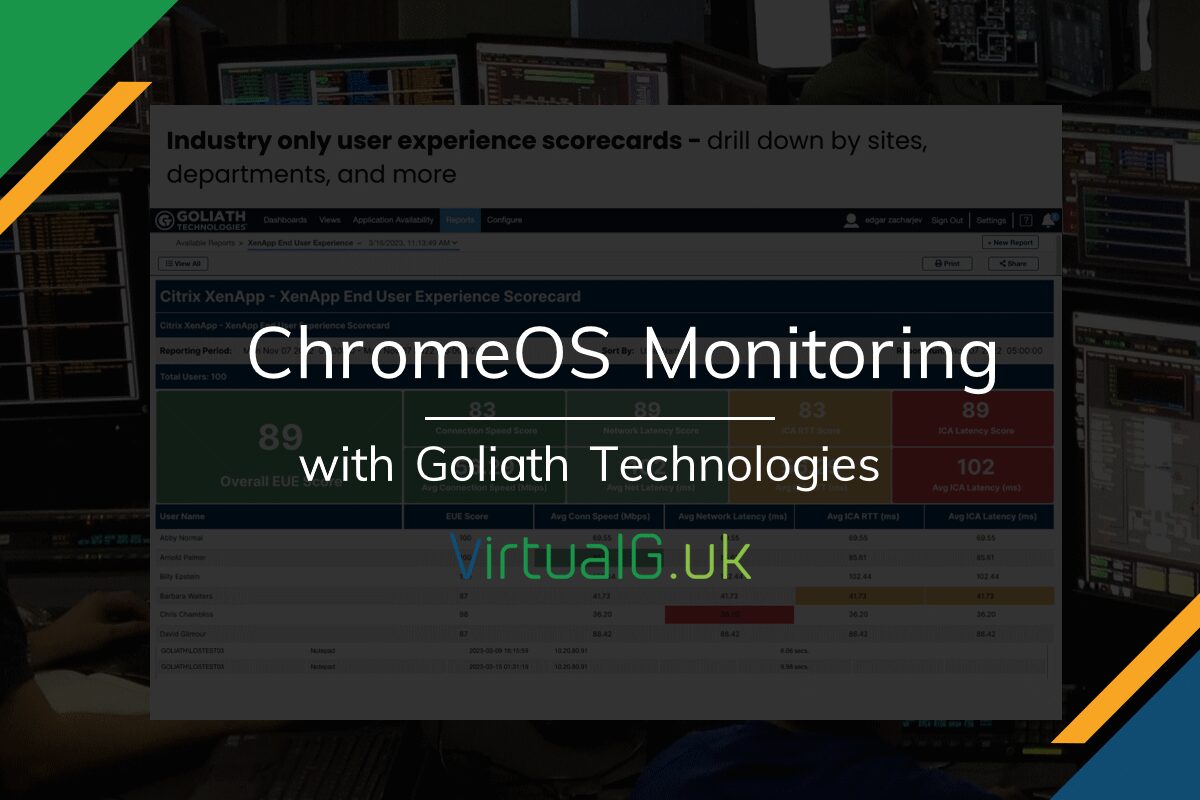
The above screenshot demonstrates the reporting capability. Notice how the entire environment is evaluated, and then certain users are called out at the end of the report. These are likely users with a poor user experience and could be proactively called to see what challenges they are facing.
Such reports can be drilled into by location and department, depending on what information you are looking for.
Overview
My impressions of Goliath Technologies and their ChromeOS monitoring software are great. It’s nice to see a company taking user experience seriously while offering an easy-to-use, yet comprehensive solution. I am seeing more ChromeOS devices in use, likely due to reduced cost and the movement to “work from home” so it’s critical that solutions such as this exist to help keep users connected and able to work, worry-free!
Further Reading & Demo
For more information about Goliath Technologies and their ChromeOS Monitoring capabilities, you can check the official product page.
You can also request a demo and watch a short video introducing their key capabilities.
Be sure to read the latest customer success story here.


