Back in April, VMware announced vRealize Operations Manager 7.5. I wrote a post about all the new features in the 7.5 release here.
Now that 7.5 has been generally available for a while, I’ve put together this article which explores the options in the new improved application monitoring feature.
The first thing to note is that there is a new and improved agent which gets deployed onto your virtual machines. While many vROps features work with just VMware tools installed, many of the application and operating system monitoring features are not enabled until the agent is installed. Fortunately, the new agent named “Telegraf” is the one used already in VMware’s Wavefront solution so this is already tried and tested over many deployments with existing customers.
The other important note is that in order to make use of the new agents, we need to deploy another appliance / Virtual Machine. This is the Application Remote Collector. Similar to a standard Remote Collector, this appliance is used to connect to the agents, offloading that work from the main vROps cluster.
To get started with the new application monitoring, there are a couple of things to do:
1. We need to first set up the environment
Home > Monitor Applications > Configure Application Monitoring
Since we are using vROps, we will send all metrics to this vRealize Operations Manager installation:
Hit the save button, to, well, save!
2. Activate the Application Management Pack
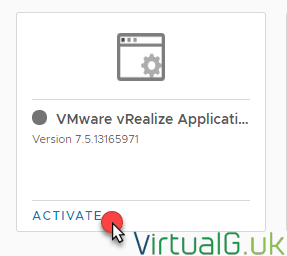
Next, we need to activate the Application Management Pack. This is a 2 step process. Hit the Activate link to start:
You will be redirected to the Solution Repository. Here find the VMware vRealize Application Management Pack and activate it:
Once you hit this button, the management pack is installed and activated automatically. There is no need to download it from Solution Exchange and upload it like you had to with management packs of previous versions.
3. Download and deploy the Application Remote Collector OVA
Love it or hate it, we have to install a dedicated remote collector for collecting application metrics. This is a topology change from previous releases. In previous releases, we would install agents on your endpoints and they would communicate back to the vROps cluster. From 7.5 we deploy a dedicated application collector VM and the agents are pointed to the new collector instead.
Navigate to Administration > Configuration > Application Remote Collector
Select the download icon to download the OVA
- Once the OVA finishes downloading, deploy it to your vSphere environment via the vSphere Client.
Ensure you have created an A and PTR record in DNS before the deployment commences.
I won’t document the deployment of the OVA here as it’s straightforward enough.
4. Configure the Application Remote Collector
- Once the OVA is deployed, power it on.
- After boot, login to the appliance via the console with the default username and password: root / vmware
- Change the password when prompted.
I prefer to use SSH rather than the console going forward, first you will need to start ssh though:
- systemctl start sshd
- SSH into the appliance and login with the root user again
- Edit the NTP configuration file to include local NTP servers
- vi /etc/ntp.conf
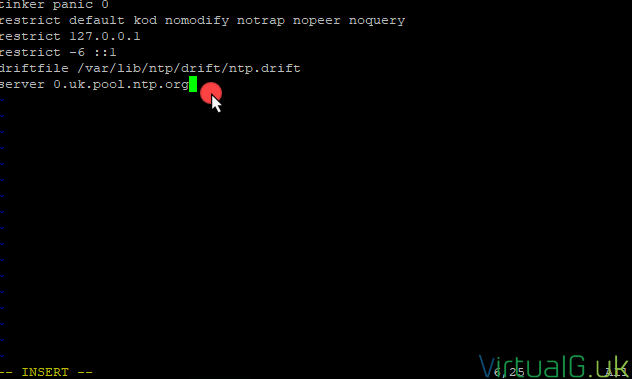
- Append your NTP servers to the bottom of the file like so:
- Save the file with :wq
- Start the ntpd service: systemctl start ntpd && systemctl enable ntpd
If you need to change any of the deployment settings for the appliance, you can login to the web portal on https://hostname:5480 using the root username and the password you created earlier.
5. Link vROps to the Application Remote Collector
- Log back into the vROps node and navigate to:
- Administration > Configuration > Application Remote Collector
- Hit the + icon
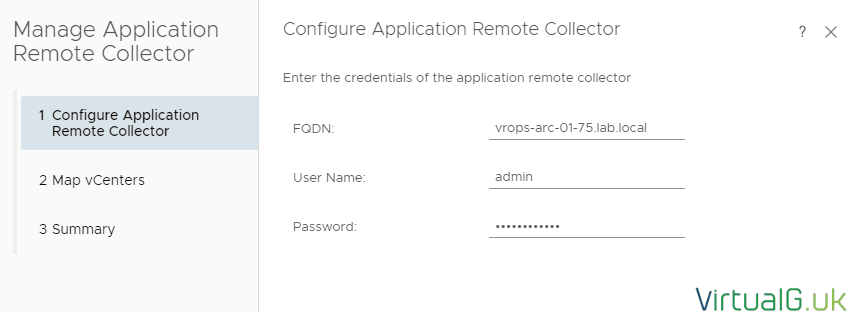
- Specify the details as requested
- The admin password is the one you created at the time of deploying the OVA, not the one we changed earlier
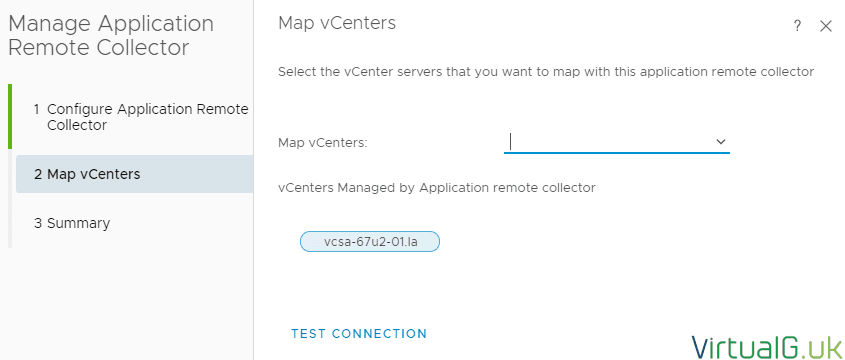
- Specify the vCenter Servers which you want to connect this Application Remote Connector with. If this is a fresh install of vROps, then you need to add your vCenter servers on the vROps solutions page first.
- Hit “Test Connection” which will verify connectivity and credentials
- Finally, select Next and Finish to complete the link
- After a few minutes, the Application Remote Collector should show as healthy in the vROPs UI
6. Deploy Agents
The really nice things about the vROps 7.5 release is the ability to push the agent install, upgrade and removal from within vROps.
You need VMware tools to be running on the Virtual Machine and there are some other considerations which are listed in the official documentation here
- Once the pre-requits are met, navigate to Administration > Inventory > Manage Agents
- A list will be shown with all the VMs in the environment. From here you can see the agent status, version and collection status, along with a few other bits of useful information.
- If VMware tools are installed, selecting one of the VMs in this list will expose the Install, Uninstall and Update agent options for that Virtual Machine:
In this example, I’m going to deploy the agent to a Windows Server and CentOS Virtual Machine so I’ve selected both with the CTRL key and selected the Install icon.
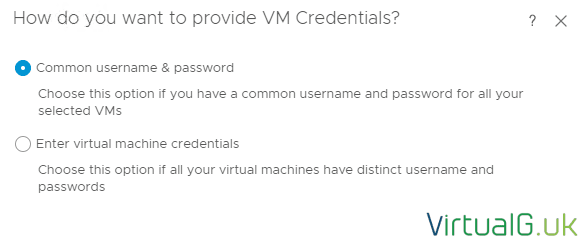
- Now, because my VMs have different usernames and passwords, I select the 2nd option but if all VMs have the same credentials then you can use the easier 1st option in the VM Credentials window.
Remember to check the official documentation here to ensure you have enough permissions set to deploy the agents this way.
If you use the 2nd option, you need to download the CSV file and enter your usernames and passwords in plain text. Hopefully, there will be a more secure way (perhaps built into the UI) to do this in a future release.
- Once done, hit Install Agent to proceed
- After the agent(s) are installed you can refresh the Manage Agents pane in vROps to see the Agent status, they should be running.
- Now we just need to wait for 1 collection cycle for the Service Discovery to complete.
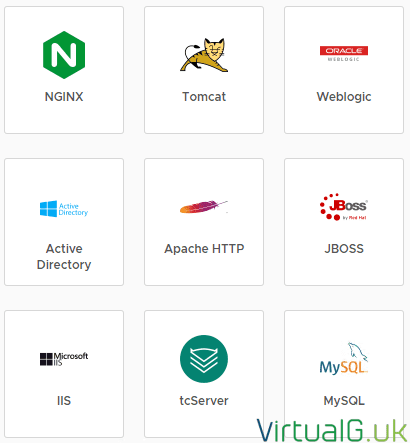
- The list of supported services out of the box can be found on the Home > Monitor Applications page. Version 7.5 has the following:
In my environment, the Windows Server has the IIS role installed, this is reflected in the Manage Agents tab after the agent was installed:
7. Enabling Application Monitoring
Now that the agents are installed, we need to enable the applications to be monitored on a per VM basis.
- First, navigate to Administration > Inventory > Manage Agent
- Select the VM to enable application monitoring for
- Hit the “Manage Service” dropdown as pictured below
- Select the application you wish to monitor and enter all required details for this application.
- Save and Close to complete the setup
8. What’s next?
This depends on what you want to accomplish.
The good news is that some out of the box content will be made instantly available to you.
Dashboards
The Troubleshoot an Application dashboard is out fo the box content.
To load it, navigate to: Dashboards > All Dashboards > Performance and Troubleshooting > Troubleshoot an Application
Metrics
All vROps aware metrics related to your applications that are enabled will now be available within vROps as they are triggered.
You can check what is available and enabled/disabled in your vROps policy.
You can also see what metrics you can use from the All metrics page for your application object.
- To find this, simply use the search on the top right of the vROps main pane and enter the name of the application you gave it earlier.
- Select your application and navigate to the All Metrics tab
Creating your own Symptoms, Alerts, Views, Dashboards & Reports
Now that you have access to the available metrics and properties for your applications, you can start to build out your custom Symptoms, Alerts, Views, Dashboards & Reports as you normally would after installing a management pack.
I hope this post was useful, the initial setup of the new Agents is a little more time consuming than before but once the basics are in place it’s actually much faster to install, upgrade and remove the agents than ever before.
The next post will dive a bit deeper into the Telegraf agent and show a few extra things we can do to maximise the value of vROps to your organisation.
As always, please let me know if you have any feedback and I’ll be sure to incorporate it into the post.

