I see questions like this all the time:
- I’ve installed vROps, but is that it?
- Am I missing something?
- How does this software help me?
- How can I get my “moneys worth” / ROI
I hope to answer some of these questions by exploring some of the features that vROps offers:
Alerting
First you need to determine why you need a tool such as vROps. The standard use-case is usually to monitor a vSphere environment and to alert on key issues. Fortunately out of the box vROps will trigger alarms for all core vSphere issues but it will not alert you of anything unless you login.
To resolve this, setup notifications:
- Navigate to Administration > Management > Outbound Settings
- Select the + icon and choose “Standard Email Plugin” – Other options are available!
- Enter your mail server details and test. The usual settings required are Simply SMTP Host (Your mail server) & SMTP Port (25)
- If the test fails, you may need to modify your mail server relay configuration to allow vROps to relay via the mail server
- Navigate to Alerts > Alert Settings > Notification Settings
- Select the +
- Enter a name for the alert such as “Critical alert notifications”
- From the drop down choose “Standard Email Plugin” & select your instance
- Enter a recipient email address & description for the alert
- Under filtering criteria, as an example set the Criticality as “critical”
- Set any other required filters such as Scope to limit what objects the alert will trigger on (Virtual Machines for example)
- In the screenshot below, an email will be sent every time a critical alert is detected by vROps
- You can set an advanced filter to only send alerts when they occur (new) and not when they are resolved
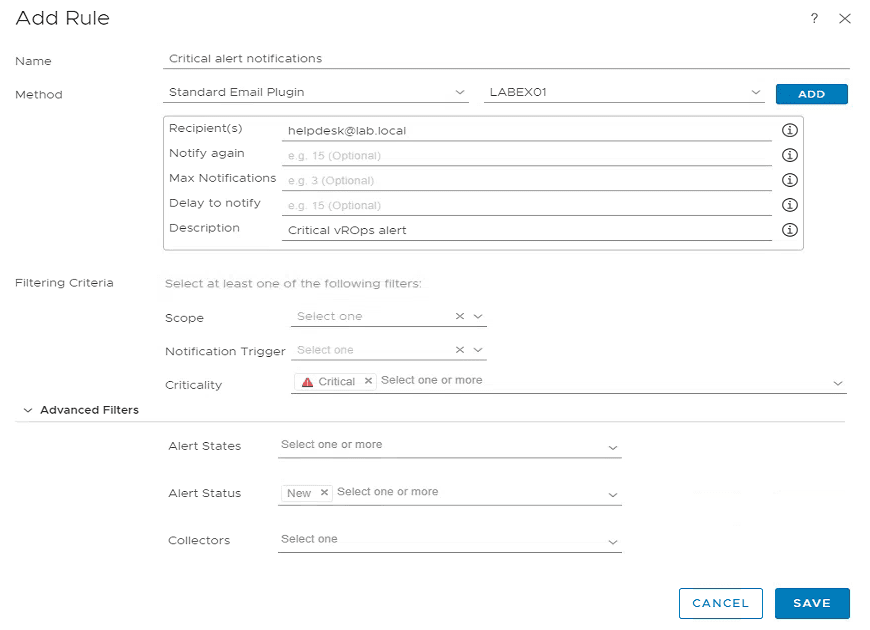
Setting up notification alerts is simple but also very flexible. To get the most out of notifications, fine tune them as needed. This may require several notifications to be configured.
Dashboards
If you are fortunate to have an advanced or enterprise version of vROps then you can customize dashboards:
For example you could create a dashboard from an existing view that displays VMware tools status for all your Virtual Machines:
- Navigate to Dashboards > Actions > Create Dashboard
- Give the dashboard a name “VMware Tools Status”
- In the widget list, select View and drag it to the right canvas, expand the view size if required by dragging the bottom right corner
- On the top right of the view select the edit pencil button and search for the “VMware Tools Status Summary” List
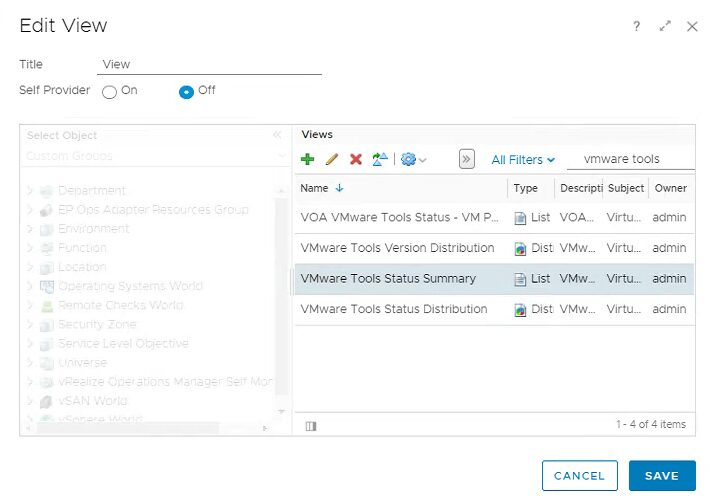
- Change “Self Provider” to On and choose an object that contains virtual machines such as a vCenter Server:
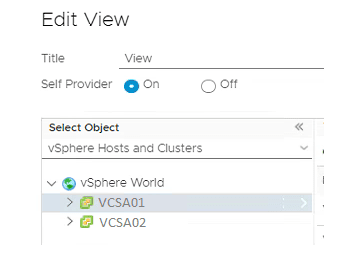
- Select Save to see the view populated on the dashboard
- Save the dashboard and select it from the Dashboards menu to view it
- Remember that you can add more than one widget to a dashboard

Symptom Definitions
Suppose you have a specific symptom that you would like to alert on. For instance when SSH is enabled on a host:
- Navigate to Alerts > Alert Settings > Symptom Definitions > Metric / Property
- Select the plus + icon
- Under “Base object type” select “Host System” because we are looking for a host based symptom
- Change “Metrics” to “Properties” since the SSH service is a property of a host and not a measurable metric as such
- On the filter type SSH and expand the options below until you see the SSH property
- Once you see SSH, double click it to add it to the canvas on the right
- Change the options to say: SSH Enabled is Warning when Property Equals true
- Save the symptom
This symptom isn’t very useful until you create an alert definition based on this symptom
Alert Definitions
Creating alert definitions based on symptoms lets you build a series of very detailed alerts which will show up in the vROps alerts pane. You can also create a notification as we saw earlier based on an alert definition.
Using our new SSH Enabled symptom, we will create an alert definition:
- Navigate to Alerts > Alert Settings > Alert Definitions
- Select the plus + icon
- Give the Alert a name such as “SSH is enabled”
- Set the base object type to “Host System”
- Under “Alert Impact” specify what is impacted, ie Risk since leaving SSH enabled could be determined as a risk rather than a health or efficiency alert. This option determines where in vROps that the alert show up. Think of it as an alert category.
- Since on the symptom we specified that Warning is the level of the alert, we can specify “Symptom Based” for the “Criticality”
- Select an “Alert Type and Subtype” for example: “Virtualization/Hypervisor Configuration”
- Wait cycle and cancel cycle are the number of vROps cycles to wait before triggering / canceling the alert. The default collection cycle in vROps is 5 minutes. For example, setting wait cycle to 3 would mean that only if the alert was active for 3 x 5 minute cycles, would you see the alert triggering in vROps
- Under “Add Symptom Definitions” search for the “SSH Enabled” symptom created earlier with the filter. Drag it to the right canvas.
- Note that you can add more than one symptom to trigger an alert. Ie only trigger the alert if “SSH Enabled” and “Host is not in maintenance mode” are true (This would be an all rule since all symptoms would have to evaluate before the alert triggering. You can also set any rules so that the alert is triggered if any of the defined symptoms are met.
- Optionally add a recommendation so that users know how to resolve the alert. You could create a new Recommendation to say “Disable SSH on the host” and provide a hyperlink to the VMware KB article
- Click Save to finish
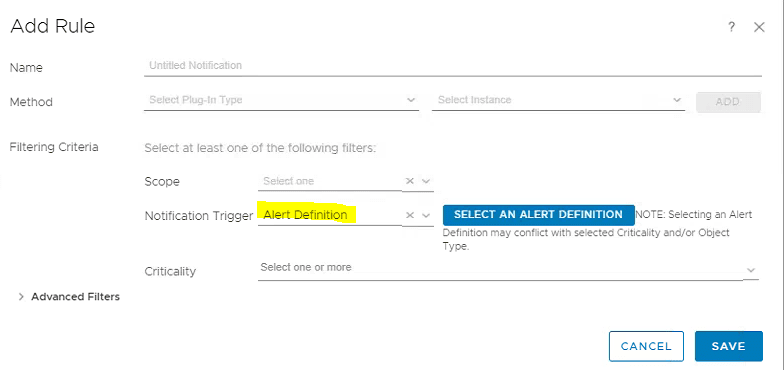
Optionally create a Notification (As we did earlier) to alert you via email if this specific alert definition is triggered:
This concludes the blog post. If you have any feedback or suggestions to add to this post, please reach out below or via Twitter


